Analyzing Wait Events for Specific SQL in Oracle
Introduction
What are Wait Events?
Analyzing Wait Events Using Active Session History (ASH)
Analyzing Wait Events Using Automatic Workload Repository (AWR)
Example: Understanding SQL Performance Issues
Conclusion
Introduction
In Oracle Database, wait events provide critical insight into the performance of SQL statements. By understanding where time is spent during SQL execution, you can identify and resolve
performance bottlenecks. This blog post will guide you through the process of analyzing wait events for a specific SQL statement using two powerful Oracle features:
Active Session History (ASH) and
Automatic Workload Repository (AWR).
What are Wait Events?
Wait events in Oracle Database indicate where sessions spend time while executing SQL statements. They help database administrators (DBAs) understand performance issues by pinpointing
the exact events causing delays. Common wait events include
I/O waits,
lock waits, and
CPU waits. By analyzing these events, DBAs can optimize SQL performance and enhance overall database efficiency.
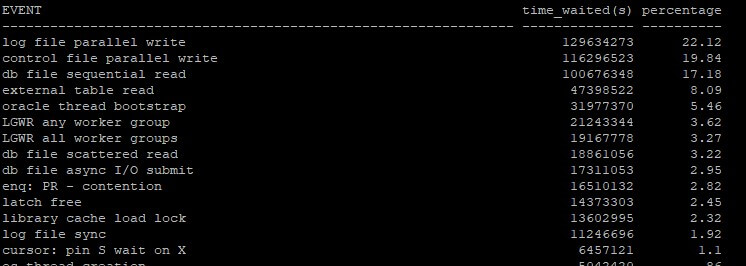
Analyzing Wait Events Using Active Session History (ASH)
Active Session History (ASH) captures sampled session activity in Oracle Database. It helps in real-time performance diagnostics by providing detailed information about session waits. The following SQL script retrieves wait event information for a specific SQL statement from the ASH:
-- Shared Pool
select
    event,
    time_waited "time_waited(s)",
    case when time_waited = 0 then
        0
    else
        round(time_waited*100 / sum(time_waited) Over(), 2)
    end "percentage"
from
    (
        select event, sum(time_waited) time_waited
        from v$active_session_history
        where sql_id = 'SQL_ID'   --REPLACE THE SQL_ID HERE
        group by event
    )
order by
    time_waited desc;
Explanation of the Script
This script performs the following tasks:
- Retrieves wait event data from
v$active_session_history for the specified SQL ID.
- Aggregates the total wait time for each event.
- Calculates the percentage of total wait time for each event.
- Orders the results by the total wait time in descending order.
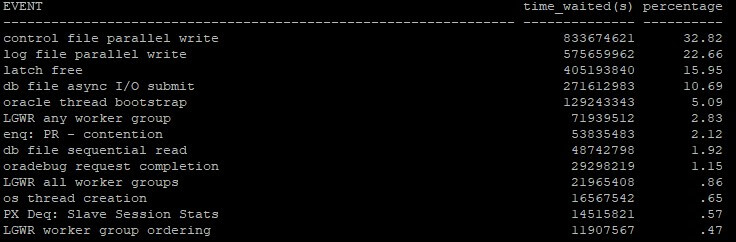
Analyzing Wait Events Using Automatic Workload Repository (AWR)
Automatic Workload Repository (AWR) provides a historical view of database performance. It collects, processes, and maintains performance data, which helps in long-term performance analysis and tuning. The following SQL script retrieves wait event information for a specific SQL statement from AWR:
-- AWR
select
    event,
    time_waited "time_waited(s)",
    case when time_waited = 0 then
        0
    else
        round(time_waited*100 / sum(time_waited) Over(), 2)
    end "percentage"
from
    (
        select event, sum(time_waited) time_waited
        from dba_hist_active_sess_history
        where sql_id = 'SQL_ID'  --REPLACE THE SQL_ID HERE
        group by event
    )
order by
    time_waited desc;
Explanation of the Script
This script performs similar tasks as the ASH script but uses historical data from
dba_hist_active_sess_history:
- Retrieves wait event data from
dba_hist_active_sess_history for the specified SQL ID.
- Aggregates the total wait time for each event.
- Calculates the percentage of total wait time for each event.
- Orders the results by the total wait time in descending order.
Example: Understanding SQL Performance Issues
Let's consider an example where we want to analyze the performance of a specific SQL statement identified by its SQL ID. By using the provided scripts, we can gather detailed wait event information from both ASH and AWR.
Step-by-Step Example:
1. **Identify the SQL ID**: Assume the SQL ID is
'5auuumydvc0ym'.
2. **Run the ASH Script**: Replace 'SQL_ID' with
'5auuumydvc0ym' in the ASH script and execute it.
3. **Run the AWR Script**: Replace 'SQL_ID' with
'5auuumydvc0ym' in the AWR script and execute it.
4. **Compare the Results**: Analyze the wait events from both ASH and AWR to understand the current and historical performance issues.
Interpreting the Results:
**High Wait Times**: Identify events with the highest wait times and percentages.
**Frequent Wait Events**: Look for recurring wait events in both ASH and AWR.
**Performance Bottlenecks**: Focus on wait events that indicate resource contention or inefficient query execution.
Conclusion
Analyzing wait events is a powerful technique for diagnosing and resolving SQL performance issues in Oracle Database. By leveraging ASH for real-time analysis and AWR for historical data, you can gain comprehensive insights into the behavior of specific SQL statements. Regularly monitoring and analyzing wait events will help maintain optimal database performance and ensure efficient SQL execution.
Understanding and addressing wait events will lead to faster query performance and a more efficient Oracle Database environment, ultimately benefiting your overall system performance.
Related content